
Study Notes · Market Maker Primer
Study Notes: Market Maker Primer – Intro To ICT Optimal Trade Entry
 by Anthony TranUpdated on Aug 6, 2025
- Min read
- 5
- Sections
- 13
Disclaimer: Educational content based on personal experience, not financial advice. Futures trading involves substantial risk. Read full disclaimer
In this article
- 01What is Optimal Trade Entry (OTE)?
- 02The Basic Idea: Buy the Dip, Sell the Rally
- 03Why Does This Work?
- 04The Three Simple Steps
- 05The Fibonacci Tool Settings
- 06Where to Take Profits
- 07Risk Management: The 2-to-1 Rule
- 08A Simple Trading Plan (Fits on a Business Card!)
- 09Key Levels to Watch
- 10Common Mistakes to Avoid
- 11Practice Exercise
- 12Remember: It’s Not Magic
- 13Final Thoughts
These are my study notes from ICT Market Maker Primer – Intro To ICT Optimal Trade Entry. I’m documenting them for personal review and to share my trading journey.
Original ICT video: https://www.youtube.com/watch?v=Cg0-CFJOJvg
What is Optimal Trade Entry (OTE)?
Optimal Trade Entry, or OTE for short, is a simple trading pattern that helps you buy low and sell high. Think of it like waiting for a sale at your favorite store – you don’t buy when prices are high, you wait for the discount.
The Basic Idea: Buy the Dip, Sell the Rally
When the market is going up (bullish):
- Wait for price to pull back (go down a little)
- Buy during that pullback
- Sell when price goes up again
When the market is going down (bearish):
- Wait for price to bounce up a little
- Sell during that bounce
- Buy back when price goes down again
It’s like catching a ball that’s bouncing – you time your catch when it comes back to you.
Why Does This Work?
Big banks and institutions move the markets. They need to:
- Buy lots of shares/currency at good prices
- Sell lots of shares/currency at good prices
When they buy, they can’t do it all at once or prices would shoot up too fast. Instead, they buy some, let price go down a bit, then buy more. This creates the “dip” we want to buy.
The Three Simple Steps
Step 1: Find the Direction
Look at monthly and weekly charts to see if the market is:
- Going up overall = Look for buying opportunities
- Going down overall = Look for selling opportunities
Step 2: Wait for the Impulse Move
An “impulse move” is when price makes a strong move in one direction. It’s like when someone throws a ball hard – it moves fast and strong.
For buying: Wait for a strong move UP that breaks above a recent high For selling: Wait for a strong move DOWN that breaks below a recent low
Step 3: Buy the Pullback (OTE Zone)
After the strong move, price will “pull back” or retrace. This is your buying opportunity.
The OTE Zone is between 62% to 79% of the pullback
Think of it like a rubber band – it stretches out (impulse move), then snaps back partway (pullback to OTE zone), then stretches out again (your profit).
The Fibonacci Tool Settings
You’ll need these levels on your chart:
- 0% = First profit target
- 62% = Best entry level (try to buy here)
- 70.5% = Sweet spot for entry
- 79% = Deepest entry level
- 100% = Your stop loss goes here
Where to Take Profits
First Profit: Take some money off the table just below the previous high Second Profit: Take more at the 127% extension level
Final Profit: Let a small portion ride to the 162% extension
Risk Management: The 2-to-1 Rule
For every $1 you risk, you should try to make at least $2 on your first profit target. This keeps you profitable even if you’re wrong sometimes.
Example:
- Risk: $100 (distance from entry to stop loss)
- First profit target: $200 minimum
- If you make $200 but lose $100 on bad trades, you’re still ahead
A Simple Trading Plan (Fits on a Business Card!)
- Market Direction: Is it going up or down overall?
- Entry Signal: Strong move + pullback to 62-79% zone
- Risk: 0.5% of my account maximum
- Exit: Take profits at planned levels
- Stop Loss: Just beyond the pullback low/high
Key Levels to Watch
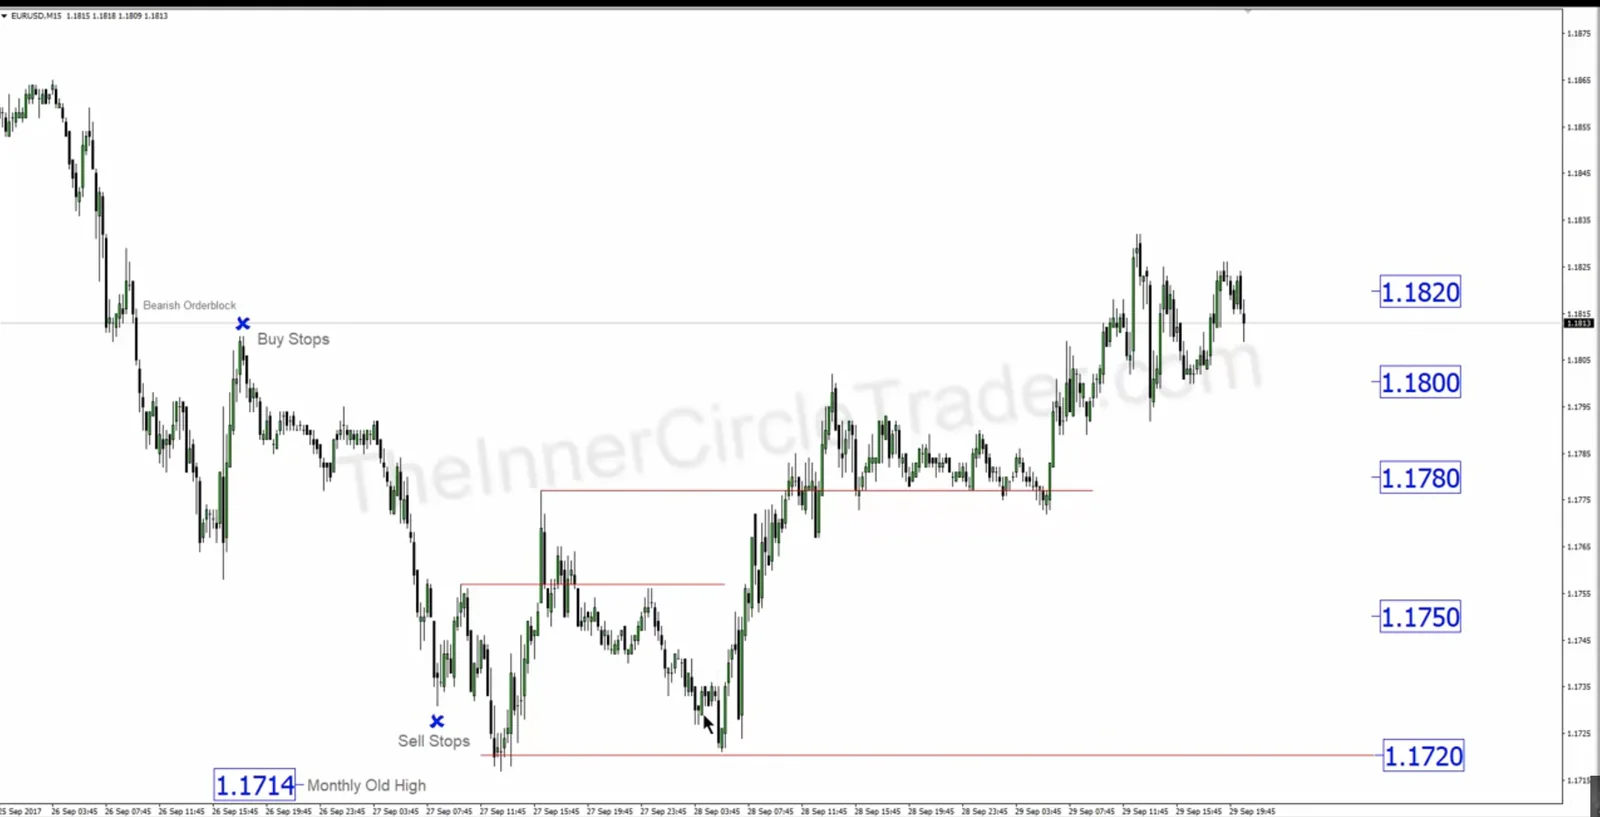
Markets love round numbers. Watch for reactions at:
- Full figures: 1.1700, 1.1800 (in forex)
- 20 levels: 1.1720, 1.1820
- 50 levels: 1.1750, 1.1850
- 80 levels: 1.1780, 1.1880
These are like magnets for price – it often bounces off them.
Common Mistakes to Avoid
1. Trading too small timeframes Stick to 4-hour, daily, and weekly charts. One-minute charts are just noise.
2. Moving stops too quickly Give your trade room to breathe. Don’t panic if price moves against you a little.
3. Not taking first profits Always take some profit at your first target. The market can always turn against you.
4. Overcomplicating things You don’t need 20 indicators. Price action and these simple levels are enough.
Practice Exercise
- Find a recent strong move up on any chart
- Draw a line from the low to the high of that move
- Mark the 62% and 79% pullback levels
- See if price bounced from those levels
- Check if it then went higher
Remember: It’s Not Magic
- This pattern works because of how big institutions trade
- You won’t win every trade – even 60% winners can be very profitable
- Focus on finding good setups, not trading every day
- Risk management is more important than being right
Final Thoughts
Optimal Trade Entry is like learning to ride a bike. At first, it seems complicated with lots of moving parts. But once you understand the basic concept – buy the dip after a strong move up – it becomes much simpler.
Start by paper trading (practicing without real money) until you can spot these patterns easily. Then gradually start trading small amounts as you build confidence.
The key is patience. Wait for the clear setups. Don’t force trades when the pattern isn’t there. Good traders are like good hunters – they wait for the perfect shot.
Disclaimer: Trading involves substantial risk and is not suitable for all investors. Past performance does not guarantee future results. This content is for educational purposes only and should not be considered financial advice. Always consult with a qualified financial advisor before making trading decisions.
Keep reading