
Study Notes · Market Maker Primer
Study Notes: Market Maker Primer – The ICT ATM Method
 by Anthony TranUpdated on Aug 4, 2025
- Min read
- 6
- Sections
- 12
Disclaimer: Educational content based on personal experience, not financial advice. Futures trading involves substantial risk. Read full disclaimer
In this article
These are my study notes from ICT Market Maker Primer – The ICT ATM Method. I’m documenting them for personal review and to share my trading journey.
Original ICT video: https://www.youtube.com/watch?v=30petm6SZz0
What is the ICT ATM Method?
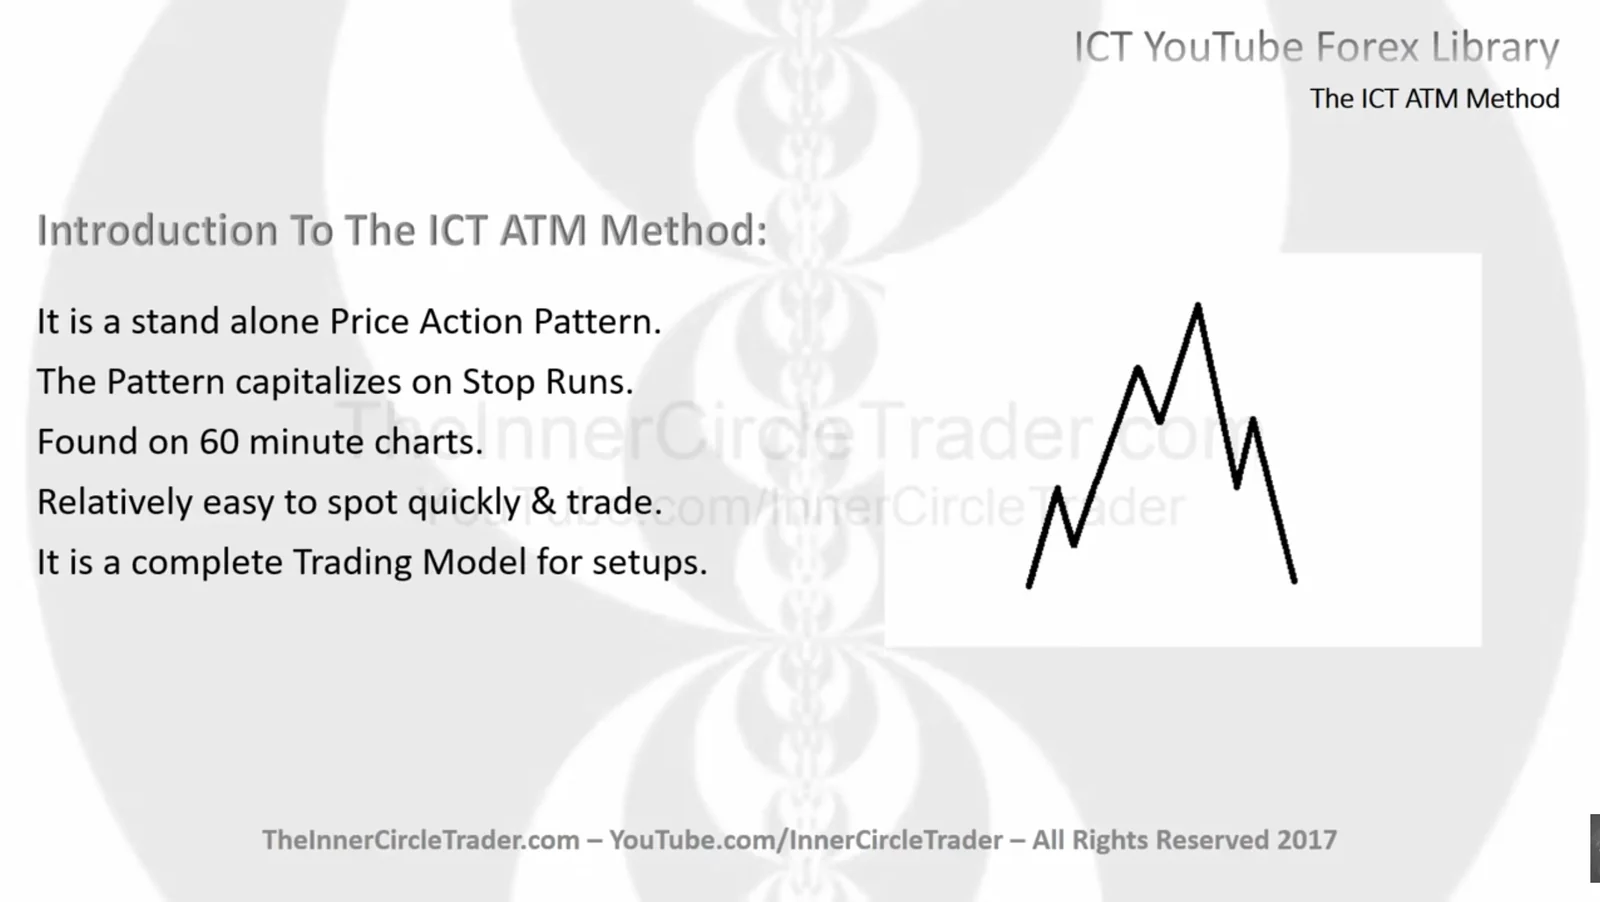
The ICT ATM Method is a simple way to trade currency pairs (like EUR/USD or GBP/USD). Think of it like finding the perfect moment to buy or sell when prices bounce off important levels.
The “ATM” doesn’t stand for the cash machine at your bank. Instead, it’s a pattern that looks for specific price movements that happen over and over again in the markets.
Why This Method Works
This method works because it focuses on stop runs. Here’s what that means in simple terms:
- Traders place stop-loss orders to protect their money
- These stops often gather at obvious price levels
- Big players (banks, institutions) push prices to hit these stops
- After hitting the stops, prices often bounce back in the opposite direction
- That’s when we enter our trade
The Two Types of ATM Setups
1. Bearish ATM (For Selling)
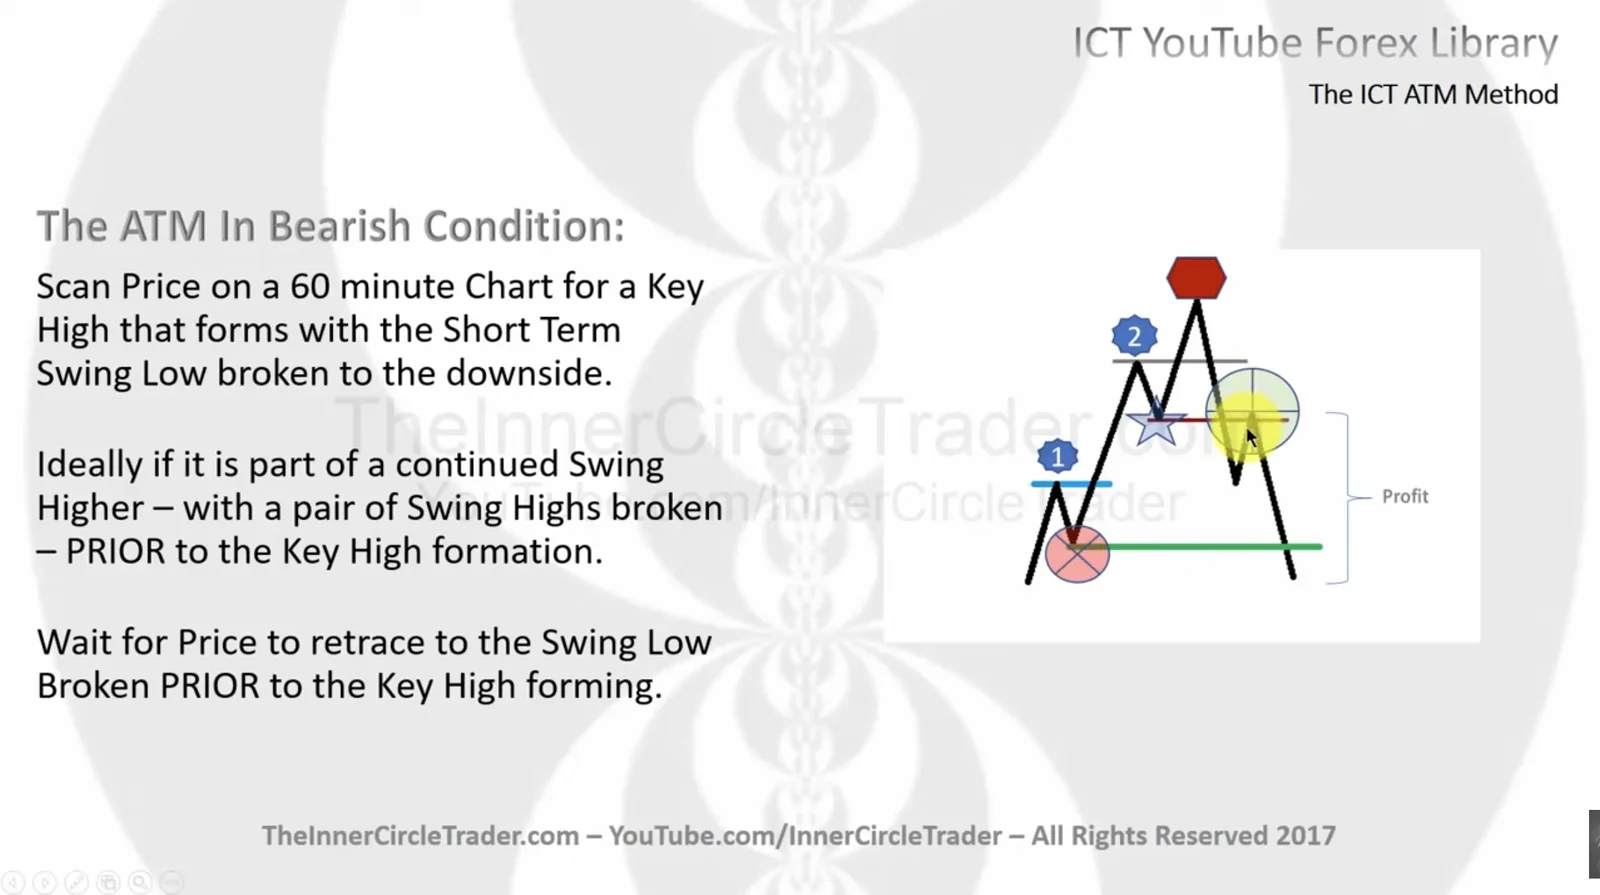
This setup happens when prices are going down. Here’s what to look for:
Step 1: Find the Pattern
- Look for a small high in price
- Watch price break above that high
- Then see price fall below a recent low
- This creates a shape like a checkmark ✓
Step 2: Wait for the Setup
- Price will come back up to test the old low level
- This old support now becomes resistance
- When price reaches this level, it’s time to sell
Step 3: Set Your Targets
- Entry: Sell when price reaches the old low level
- Target: Aim for the next low where stops are sitting
- Stop Loss: Place 1-2 pips above the highest point
2. Bullish ATM (For Buying)
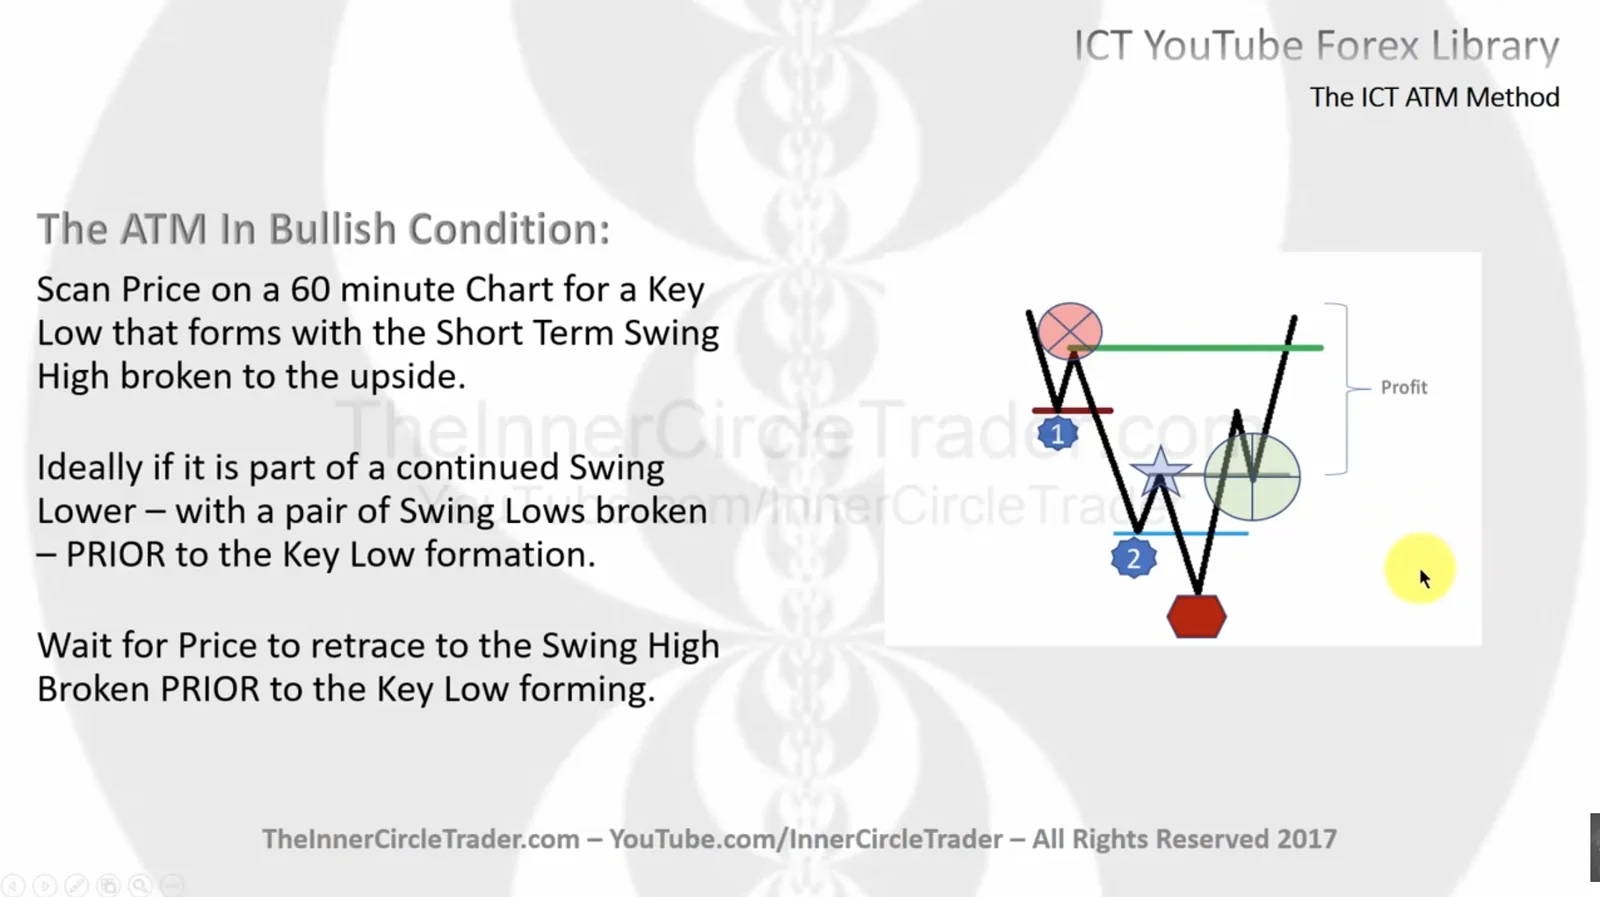
This setup happens when prices are going up. Here’s what to look for:
Step 1: Find the Pattern
- Look for a small low in price
- Watch price break below that low
- Then see price rise above a recent high
- This creates a shape like a crooked number 7
Step 2: Wait for the Setup
- Price will come back down to test the old high level
- This old resistance now becomes support
- When price reaches this level, it’s time to buy
Step 3: Set Your Targets
- Entry: Buy when price reaches the old high level
- Target: Aim for the next high where stops are sitting
- Stop Loss: Place 1-2 pips below the lowest point
What Time Frame to Use
Start with the 1-Hour Chart
- This is where you look for the main pattern
- It’s clean and easy to read
- Gives you good risk-to-reward ratios
Use Lower Time Frames to Improve
- Drop down to 15-minute charts to reduce risk
- Use 5-minute charts for even tighter stops
- Keep the same profit target but with smaller risk
Step-by-Step Trading Process
For Bearish Setups (Selling):
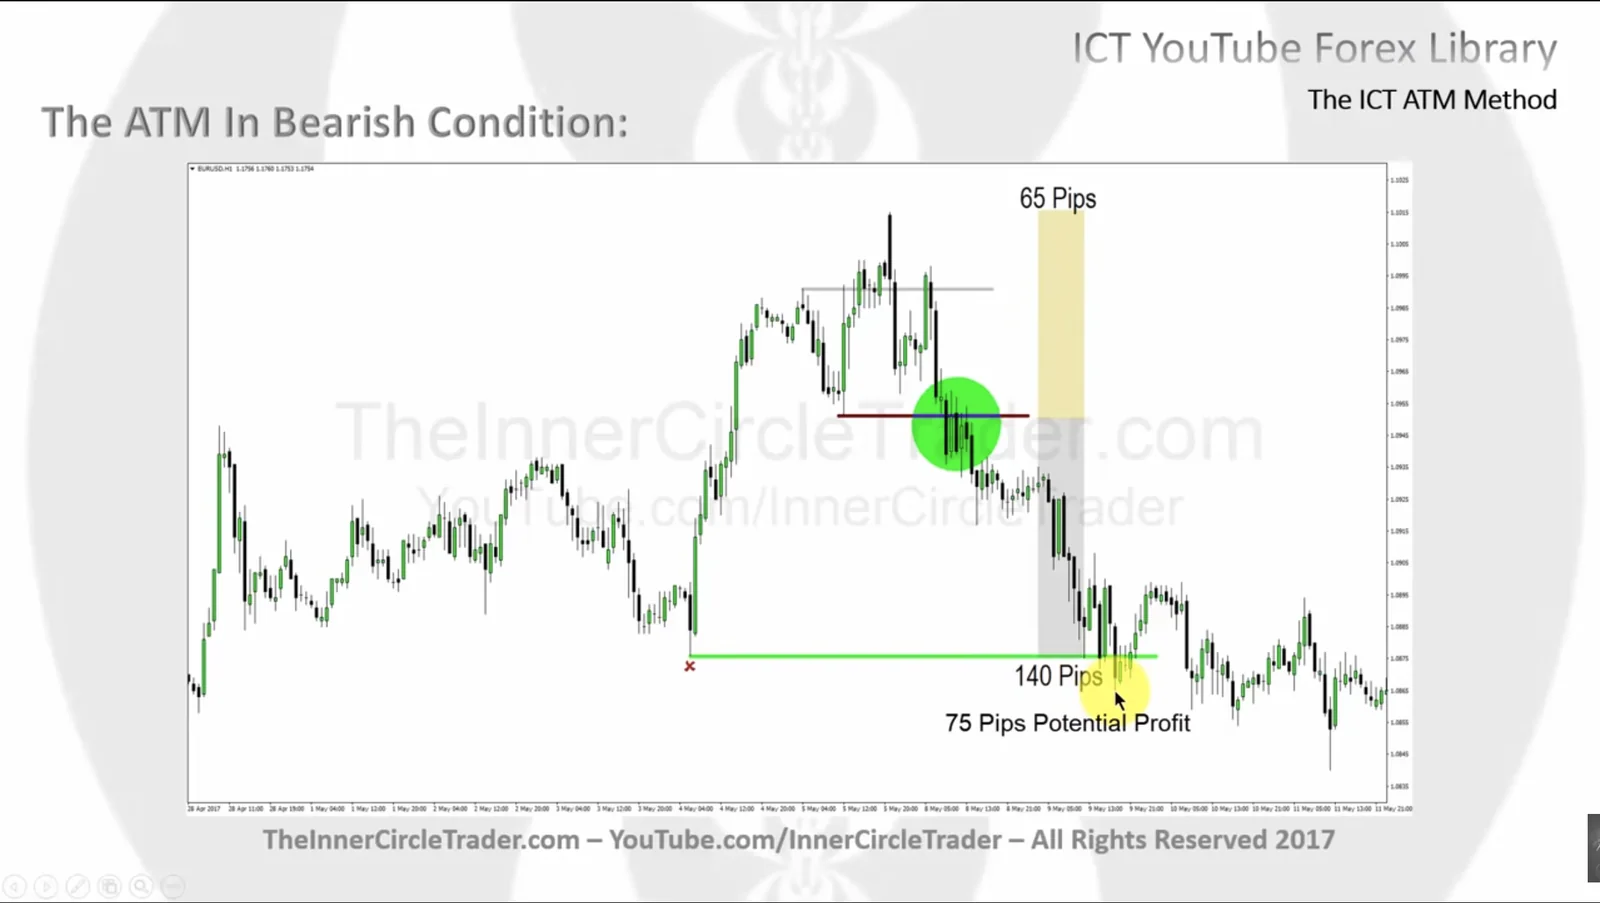
- Find the Pattern on 1-Hour Chart
- Look for a small high that gets broken
- Wait for price to fall below a recent low
- This breaks the market structure
- Wait for the Retest
- Price comes back up to the old low level
- This level should now act as resistance
- Enter the Trade
- Sell when price reaches this resistance level
- Set stop loss above the highest point
- Target the next obvious low
For Bullish Setups (Buying):
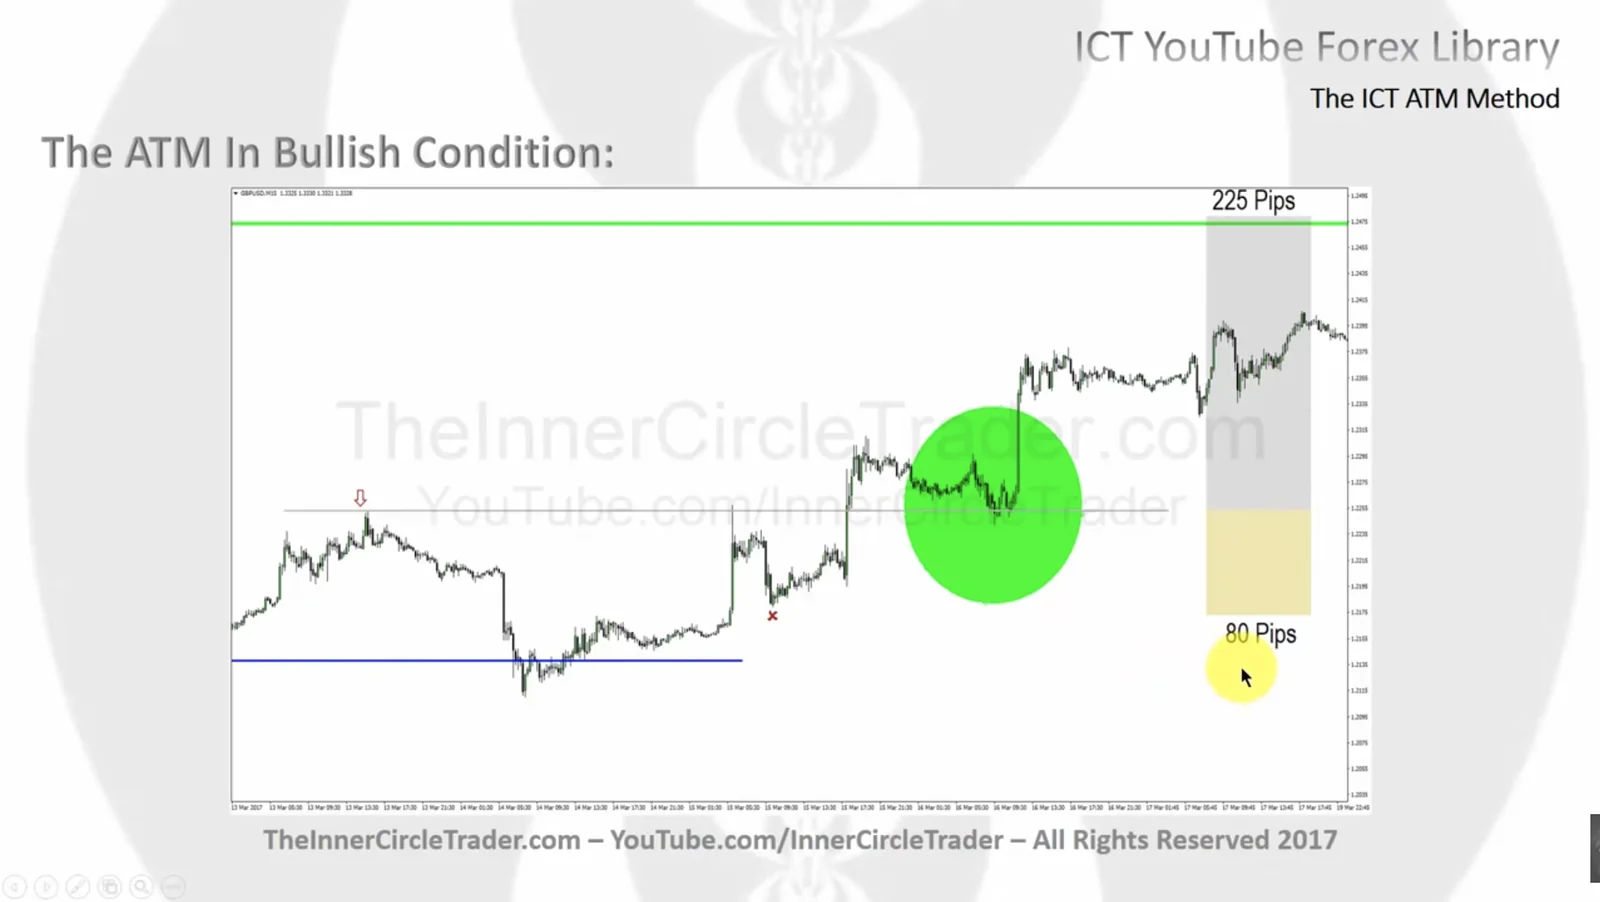
- Find the Pattern on 1-Hour Chart
- Look for a small low that gets broken
- Wait for price to rise above a recent high
- This breaks the market structure
- Wait for the Retest
- Price comes back down to the old high level
- This level should now act as support
- Enter the Trade
- Buy when price reaches this support level
- Set stop loss below the lowest point
- Target the next obvious high
Making the Setup Stronger
The ATM method works best when you see a two-stage move:
For Bearish Setups:
- First high gets broken
- Second high gets broken (this is your key high)
- Now price is “overbought” and ready to fall
For Bullish Setups:
- First low gets broken
- Second low gets broken (this is your key low)
- Now price is “oversold” and ready to rise
Risk Management Tips
- Always Use a Stop Loss
- Never trade without protecting your money
- Place stops 1-2 pips beyond the key level
- Start with Demo Trading
- Practice this method with fake money first
- Get comfortable finding the patterns
- Keep Risk Small
- Never risk more than 1-2% of your account
- Use lower time frames to reduce stop loss size
- Be Patient
- Wait for clear setups
- Don’t force trades when patterns aren’t obvious
Common Beginner Mistakes
- Trading Before the Pattern Completes
- Wait for price to break the key level first
- Don’t enter until you see the full setup
- Using Too Large Position Sizes
- Start small while learning
- Focus on learning, not making money
- Moving Stop Losses
- Set your stop and leave it alone
- Let the market prove you right or wrong
- Not Waiting for Retests
- The magic happens when price comes back to test
- Be patient and wait for the right moment
Real Example Breakdown
Let’s say you’re looking at EUR/USD on a 1-hour chart:
- You see price make a small high at 1.1050
- Price breaks above to 1.1070
- Then price crashes down to 1.1020 (breaking structure)
- Price comes back up to test 1.1040 (the old low)
- This is your sell signal
- Target: 1.1000 (next obvious low)
- Stop: 1.1055 (above the key high)
Why This Method Works
The ATM method works because it:
- Focuses on where most traders place stops
- Waits for market structure to break
- Enters when institutions are likely to push prices
- Uses clear levels for entries and exits
- Can be used on any currency pair or time frame
Getting Started
- Open a Demo Account
- Practice with fake money first
- Most forex brokers offer free demo accounts
- Start with Major Pairs
- EUR/USD, GBP/USD, USD/JPY
- These have tight spreads and good liquidity
- Focus on 1-Hour Charts
- Look for clear ATM patterns
- Mark key highs and lows
- Keep a Trading Journal
- Record every trade you take
- Note what worked and what didn’t
- Learn from your mistakes
Final Thoughts
The ICT ATM Method is a powerful tool for beginners because:
- It’s simple to understand
- It focuses on key market levels
- It has clear entry and exit rules
- It can be improved with lower time frames
Remember, trading takes time to learn. Start slow, practice on demo accounts, and focus on understanding the concepts before risking real money.
The key to success with this method is patience and practice. Wait for clear setups, manage your risk properly, and let the market come to you. With time and experience, you’ll start to see these patterns everywhere and develop the confidence to trade them profitably.
Disclaimer: Trading involves substantial risk and is not suitable for all investors. Past performance does not guarantee future results. This content is for educational purposes only and should not be considered financial advice. Always consult with a qualified financial advisor before making trading decisions.
Keep reading